
The Pareto Principle: History, Foundations, Applications, and Graphical Representation
Abstract
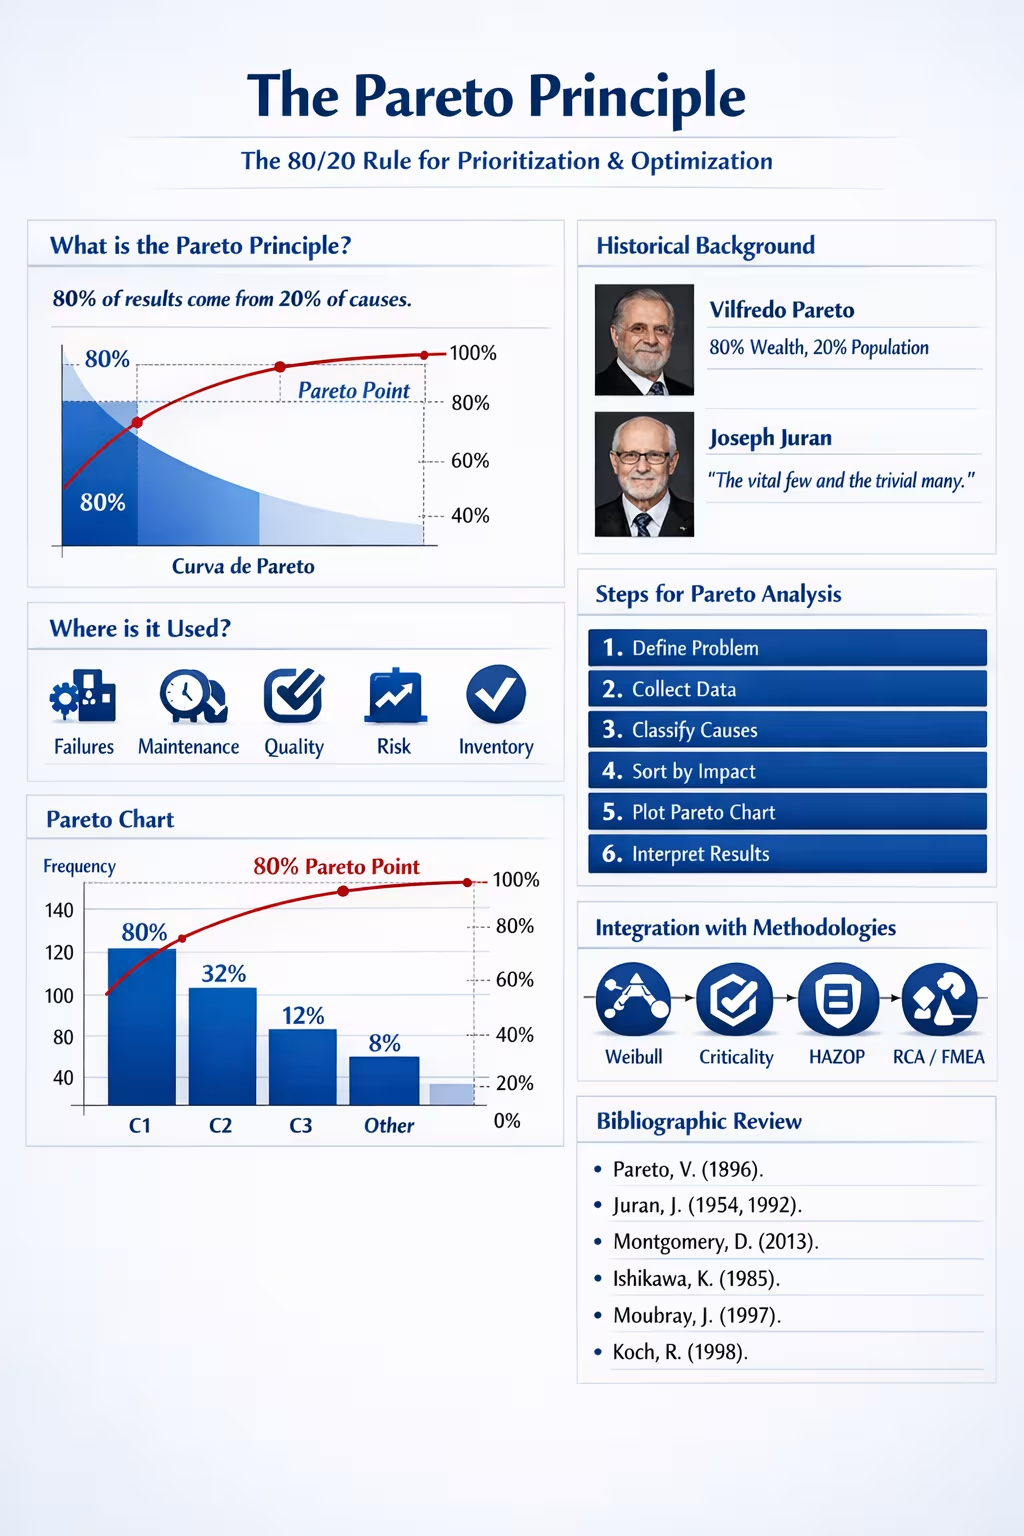
The Pareto Principle, commonly known as the 80/20 rule, states that a small number of causes often account for the majority of effects. This concept, rooted in economics and later adopted in quality management and reliability engineering, serves as a cornerstone for prioritization, resource optimization, and continuous improvement.
1. Definition
The Pareto Principle asserts that:
80% of results come from 20% of causes.
This ratio is not exact but represents a pattern of concentration observed across systems. Examples include:
- 20% of customers generate 80% of sales
- 20% of defects cause 80% of rejections
- 20% of equipment failures lead to 80% of downtime
It is a universal heuristic for identifying critical few versus trivial many.
2. Historical Background
Vilfredo Pareto (1848–1923)
An Italian economist and sociologist who discovered that wealth distribution followed a predictable imbalance—approximately 20% of the population owned 80% of the wealth. His observation became the foundation for the principle.
Joseph M. Juran (1904–2008)
A pioneer in quality management who introduced Pareto’s concept into industrial practice. He coined the phrase:
“The vital few and the trivial many.”
Juran’s adaptation transformed Pareto’s economic insight into a management tool for quality control and decision-making.
3. Applications
Industrial and Organizational Uses
- Failure analysis — Identify dominant causes of equipment breakdowns.
- Maintenance optimization — Focus on high-impact assets.
- Quality improvement — Prioritize defect categories.
- Risk management — Concentrate on critical hazards.
- Inventory control — Manage high-value items efficiently.
- Personal productivity — Focus on tasks that yield the greatest results.
Benefits
- Clear prioritization
- Efficient resource allocation
- Accelerated improvement cycles
- Enhanced decision-making clarity
4. Procedure for Pareto Analysis
- Define the problem — Select the process or issue to analyze.
- Collect data — Quantify frequency, cost, or impact.
- Classify causes — Group by type (mechanical, operational, design, etc.).
- Sort in descending order — Highest impact first.
- Calculate percentages — Individual and cumulative.
- Plot the Pareto chart — Bars for causes, line for cumulative percentage.
- Interpret results — Identify the “Pareto point” (typically around 80%).
5. Graphical Representation
Pareto Chart
A combined bar and line graph:
- X-axis: Causes or categories
- Left Y-axis: Frequency or magnitude
- Right Y-axis: Cumulative percentage
- Bars: Ordered from largest to smallest
- Line: Shows cumulative effect
- Pareto point: Marks the threshold of dominant causes
This visualization highlights where corrective actions will yield the greatest benefit.
6. Integration with Other Methodologies
Methodology
Relationship
Weibull Analysis
Identifies dominant failure modes before modeling life expectancy.
Criticality Analysis
Prioritizes assets based on impact and probability.
HAZOP
Focuses on deviations with the highest risk.
RCA / FMEA
Targets root causes with the greatest effect.
Pareto analysis often serves as the first filter before deeper diagnostic or reliability studies.
7. Bibliographic Review
Classical Sources
- Pareto, V. (1896). Cours d’économie politique.
- Juran, J. (1954). Quality Control Handbook.
- Juran, J. (1992). Juran on Quality by Design.
Quality and Reliability
- Montgomery, D. (2013). Introduction to Statistical Quality Control.
- Ishikawa, K. (1985). What is Total Quality Control?
- Moubray, J. (1997). RCM II.
- Smith & Hinchcliffe (2004). RCM—Gateway to World Class Maintenance.
- Dhillon, B. (2006). Maintainability, Maintenance, and Reliability for Engineers.
Management and Productivity
- Koch, R. (1998). The 80/20 Principle.
- Covey, S. (1989). The 7 Habits of Highly Effective People.
8. Conclusion
The Pareto Principle remains one of the most powerful tools for data-driven prioritization. Its simplicity enables rapid identification of dominant factors, guiding organizations toward efficient improvement strategies. Whether applied in engineering, economics, or personal productivity, Pareto’s insight continues to shape modern decision-making and operational excellence.
Comments